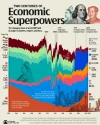
Two centuries of economic superpowers

It is interesting but it's at purchasing power parity.

The claim that the Russian economy was bigger than the UK economy was discussed on More or Less on BBC Radio 4.

As it's about superpowers and, presumably, worldwide influence, it should be at GNP or GDP

This is AI's take on it which is roughly what the BBC programme said about it.

The comparison between Russia’s economy and the United Kingdom’s economy depends on whether you measure by nominal GDP or Purchasing Power Parity (PPP): [1, 2]
  • Nominal GDP (Market Exchange Rates): The UK's economy is about 57% to 64% larger than Russia's.
    • UK Nominal GDP: Roughly $4.0 to $4.26 trillion
    • Russia Nominal GDP: Roughly $2.56 to $2.66 trillion (ranking around 9th globally) [1, https://geofactbook.com/compare/russia-vs-united-kingdom (2), 3, 4, 5]
  • Purchasing Power Parity (PPP): When adjusted for local price levels and cost of living, Russia's economy is larger than the UK's (roughly 1.5 to 1.6 times bigger, or around $7.1 to $7.5 trillion compared to the UK's $4.28 to $4.7 trillion). [1, 2, 3]
  • GDP Per Capita: The UK leads by a wide margin. UK per capita income/GDP is roughly $54,500 to $61,000, whereas Russia's per capita figure is around $15,000 to $18,500. [1, 2]
 
It's confusing because the chart says GDP but the blurb seems to suggest that they've used PPP.
 
There is alot of russian propagandists pushing dubious purchasing power parity statistics in order to elevate the role of China India and other emerging markets as a lot bigger than they really are. Also why put the russian empire at the top of a chart when it hasn't existed since 1914, surely you should also have the Ottoman , Austro Hungarian, potuguese and spanish as they were also large but failing similar to the Russian empire. In 1820 China was not part of global system it was in isolation so to put it as a huge chunk of global GDP while ignoring the other big european empires is misleading. Also why would you put indian independence in 1947 as a seismic event while ignoring the russian revolution in 1917 or the fall of the soviet union in 1991 which were far bigger global and consequential events.
 
Good points. As for the other empires, I believe Portugal and Spain lost most of their largest territories in the early 1800s. I think the Ottoman empire was in slow decline right through the 1800s. Having said that, for a full picture they would certainly deserve to be featured. The Austro-Hungarian empire on the other hand was going strong until WW1.
 
Ah, you're right. I didn't read down to see this:
All GDP figures are adjusted for purchasing power parity (PPP), accounting for differences in living costs and production across countries.
I had that More Or Less episode that you mentioned and found it interesting and clearly explained (as someone who isn't very strong on macroeconomics).
 
It's not my area, but I understand that GDP can be measured in nominal terms or PPP terms.
Yes. And they both have their relevance.

GDP in PPP terms is relevant if you're comparing the standard of living that different countries can afford their inhabitants. But of course for a meaningful comparison you'd have to factor in the number of inhabitants in each country, so GPD in PPP per capital would be the appropriate comparator. Plus, you should also consider the distribution of income; the chart shows the British Empire as having a large GDP in the nineteenth century, but it would be a big mistake to think that this meant high living standards for the majority of British subjects, who lived in India or Africa.

GDP in nominal terms would be the appropriate figure for comparing different countries' relative economic significance in the global economy - in trade, in economic muscle, in the ability to project power.
 
Also china had a larger share of global gdp (by PPP) in 1820 when it was isolated from global system for centuries than it does even today as a huge economic power ? That is simply not credible. The PPP statistics distort highly protectionist countries like china in 1820 or India today making them appear way wealthier than they really are. For example when china was closed to western industrial goods in 1820, no steam power ,no industrialisation how could it have such a large share of GDP? Also the soviet union for 80 years had shortages and inferior manufactured consumer goods relative to the west yet its PPP statistics do not show that up, a trabant or a lada (for which there was a 10 year waiting list) has the same economic weight as a VW golf in those statistics.
 
Last edited:
The chart does acknowledge that the pre-1900 data is "scholarly estimates" rather than precise measurements so, yeah, those figures are rubbery.

I don't think e.g. China being "isolated from global systems" in the early nineteenth century is necessarily a barrier to its having represented a large component of global GDP (nominal or PPP). Globalisation as we know it is something that only really gets going in the second half of the nineteenth century, with steamships and railways. There was, of course, international and even intercontinental trade before that, but for most of the countries that engaged it in it represented a relatively small contribution to their overall wealth. The UK would be an exception there, but if you're looking at global GDP the UK is an outlier, and lots of countries with relatively high GDPs didn't necessarily trade very much. And there were countries that did a (relatively) large amount of international trade but didn't get massively wealthy off it; India is an example that appears in this chart.

Tl;dr: the link between international trade and prosperity that we take for granted just wasn't there in the early nineteenth century.
 
don't think e.g. China being "isolated from global systems" in the early nineteenth century is necessarily a barrier to its having represented a large component of global GDP (nominal or PPP). Globalisation as we know it is something that only really gets going in the second half of the nineteenth century, with steamships and railways.
Well then it shouldn't be included at all then because you are not comparing like with like. China was an isolated agrarian state self isolated from the global system for centuties in 1820 therefore its statistics were meaningless in comparing it to the industrial world. So china as an isolated agrarian state had a bigger share of global gdp in 1820 than it does today as and industrial powerhouse?? In 1820 China was poor and impoverished and ripe for exploitation by the russians and british then later the japanese but it had the largest global gdp by ppp , that proves its a meaningless statistic.
 
China was an isolated agrarian state self isolated from the global system for centuties in 1820 therefore its statistics were meaningless in comparing it to the industrial world.
In 1820 China was the biggest economy in the world and accounted for a third of Global GDP.

It, along with India, accounted for around half of Global GDP in the early 1800's. By the late 1800's it's economy had collapsed due to the Opium Wars, inflicted on them by the British who were at the time, and still hold the title of, the biggest drug cartel in history. (Fun fact; HSBC was set up to handle all the profits the British were making selling drugs to the Chinese). Britain was the Medellín Cartel of the day only far bigger, far more violent and far more destructive.


Mughul India accounted for a third of the world's manufacturing output in the 17th Century. The Bengal Subah shipyards produced as many ships as the British and their ships were of superior design. They also had a massive steel industry as well as being a global player in the production of textiles and luxury goods. Then the British (using the British East India Company) utterly destroyed it economically and tried to destroy it culturally. The literacy rates plummeted while poverty and infant mortality rates soared.
 
Well then it shouldn't be included at all then because you are not comparing like with like.
Earlier in the thread we discussed the whole idea of analysing the world economy between countries and regions on a PPP basis and decided that it wasn't an especially good idea. But I don't think it's the case that it's a bad idea in the case of China in particular. If you're going to do the table on this basis, you should include China, because it was a very large part of the world economy and, if you leave it out, your table will be even more flawed.

Have a look at the white section of the table, the one that's not named. That's "every other country in the world". You can see that the rest-of-the-world share of the global economy is (eyeballing it from the table) about 4% in 1820. It grows steadily through the 19th century to about 15% by 1900. Over the same period the Chinese share of the world economy is declining from 29% to about 10% . If you don't show China separately, then it gets lumped in with the rest of the world; the relative decline of China will no longer be visible, and it will mask the relative rise of other countries. Why would that make for a better table?
 
Last edited:
Earlier in the thread we discussed the whole idea of analysing the world economy between countries and regions on a PPP basis and decided that it wasn't an especially good idea. But I don't think it's the case that it's a bad idea in the case of China in particular. If you're going to do the table on this basis, you should include China, because it was a very large part of the world economy and, if you leave it out, your table will be even more flawed.
I looked into how these tables are constructed and all the statistics for gdp and economy size for countries that were not really part of global system before 1900 are based on the "angus maddison" studies. However these made alot of assumptions that are controversial and distortionary. In the case of countries like China which were largely closed to foreign trade they simply assumed a certain level of gdp per capita and multiplied it by the population . With a huge population like China even in 1820 the level of gdp per capita you choose is crucial to the size of the economy. Its obvious then that the level of gdp per capita they chose for China was hugely inflated because it shows China as a bigger economy in 1820 relatively speaking than it is today, that is clearly bonkers.
In the case of Spain and Portugal they stripped the gdp of colonies like Brazil and south america from their data and recalculated based on their modern day country borders even though trade with these colonies was a huge component of global trade in 1820.
Also If they were going to do that why didn't they strip out eastern europe and the baltics and caucuses from the russian empire and soviet union statistics and recalculate russian gdp solely on russia itself?
Similarly they left british empire intact ,they did not strip away its colonial posessions from the data set, so ireland was included as part of british gdp but brazil was stripped from portuguese gdp. Therefore you can see how these assumptions are very distortionary and revisionary .
 
On the relevance of PPP or Nominal in deciding how wealthy a nation is, the following summary is helpful.
Gemini said:
Takeaway: While PPP shows that a person can eat well and afford shelter locally, Nominal GDP per capita reflects how easily a citizen can afford global technology, vehicles, and international travel.
Basically, cars and smartphones are the same international price (local taxes notwithstanding) whilst a haircut depends hugely on the local price of labour. A developed country with a reasonable GINI measure, distributes its income amongst its citizens and the multiplier effect inflates the Nominal measure of GDP - they are effectively buying and selling haircuts, meals out and houses from each other at prices inflated by the high productivity in internationally traded goods and services.
And in measuring PPP they use different baskets for different countries depending on their spending habits. So if a poor country buys few cars then cars, which effectively have an international price, form a relatively small part of their basket.

Below is broadly how to interpret the ratio PPP GDP/ Nominal GDP
High Ratio (> 1.5 to 3.0+) ──> Developing / Emerging Nation
Ratio Around ~1.0 ──> Developed Benchmark Nation
Low Ratio (< 1.0) ──> High-Cost Advanced Nation
 
Last edited:
Its obvious then that the level of gdp per capita they chose for China was hugely inflated because it shows China as a bigger economy in 1820 relatively speaking than it is today, that is clearly bonkers.
Why is it bonkers?

By 1820 the Qing Dynasty had been around for more than 250 years and rules a population of 450 million people (twice the size of Europe's population at the time) in a single country. It had a highly developed agrarian economy and which evolved into a land owning and produce trading peasantry, which in turn led to the development of a market economy from what was a command economy, which caused a huge growth in urbanisation.

It was administered by a well educated and structured public administration. It had a large volumes of international trade with its vassal states (such as Korea) as well as other independent countries further afield.

Internal rebellion, taxes which were actually too low, and regional tensions all weakened the country until the drug cartel that was the British Empire started the Opium Wars and Qing China finally collapsed in the later half of the 19th Century.

It is without question that in relative global terms China's economy was significantly bigger in 1820 than it is today, probably be around 50%.
 
Last edited:
In the case of Spain and Portugal they stripped the gdp of colonies like Brazil and south america from their data and recalculated based on their modern day country borders even though trade with these colonies was a huge component of global trade in 1820.
Also If they were going to do that why didn't they strip out eastern europe and the baltics and caucuses from the russian empire and soviet union statistics and recalculate russian gdp solely on russia itself?
Similarly they left british empire intact ,they did not strip away its colonial posessions from the data set, so ireland was included as part of british gdp but brazil was stripped from portuguese gdp. Therefore you can see how these assumptions are very distortionary and revisionary .
I agree with you on that. They can't measure the British or Russian/Soviet Empires as whole entities while ignoring the holdings of Spain and Portugal etc. Then again where do you draw the line?

Does Japan get to count Korea for the 35 years it occupied it up to 1945? Do they get Manchuria for 14 years?

Does China get Korea as it was a vassal state until 1895?

How long do the British get India? The British East India Company rules it from 1857 but the British Crown only ruled it from 1858. Are they being counted from 1820 or 1857?

Does America get the Philippines from 1898 or from 1902 when they finally defeated the locals who wanted to be free?

Do Mexico get the economies of Californian, Nevada, Utah, Arizona, New Mexico, and parts of Colorado, Wyoming, Oklahoma, and Kansas up until 1848 when the Americans invaded and took it from them in their first expansionist war?

It's rather complex, isn't it?
 
(Fun fact; HSBC was set up to handle all the profits the British were making selling drugs to the Chinese)

Nothing much has changed

 
Back
Top